| Source: | ||
| 1960-1967: | National Safety Council, Accident Facts,1992. | |
| 1968-1990: | U.S. DOT/RSPA/Volpe Center, Transportation Safety Information Report, annual issues, 1978-1991. | |
| 1991-1992: | Ibid., FHWA, Office of Highway Safety, HHS-12. |

| ||||||||||||||||||||
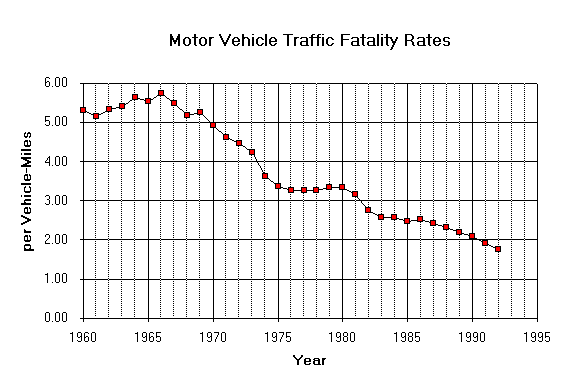
| Traffic Fatalitys Per 100 Million Vehicle-Miles | ||||||||||||||||||||
|---|---|---|---|---|---|---|---|---|---|---|---|---|---|---|---|---|---|---|---|---|
| Year | 0 | 1 | 2 | 3 | 4 | 5 | 6 | 7 | 8 | 9 | ||||||||||
| 196? | 5.30 | 5.16 | 5.32 | 5.41 | 5.63 | 5.54 | 5.73 | 5.49 | 5.17 | 5.25 | ||||||||||
| 197? | 4.92 | 4.61 | 4.47 | 4.23 | 3.62 | 3.36 | 3.25 | 3.26 | 3.26 | 3.34 | ||||||||||
| 198? | 3.35 | 3.17 | 2.76 | 2.58 | 2.57 | 2.47 | 2.51 | 2.41 | 2.32 | 2.19 | ||||||||||
| 199? | 2.08 | 1.91 | 1.75 | |||||||||||||||||
| ||||||||||||||||||||